reading-notes
Module 2 - Microsoft Azure AI Fundamentals: Explore visual tools for machine learning
Create a clustering model with Azure Machine Learning designer
Clustering is a form of unsupervised machine learning that is used to group similar items into clusters based on their features. There is no previously known cluster value (or label) from which to train the model.
Here are a few examples of clustering machine learning models:
- Cluster customer attribute data into segments for marketing analysis.
- Cluster geographic coordinates into regions of high traffic in a city for a ride-share application.
- Cluster written feedback into topics to prioritize customer service changes.
Understand steps for clustering
You can think of the steps to train and evaluate a classification machine learning model as:
- Prepare data: Identify the features in a dataset. Pre-process, or clean and transform, the data as needed. Azure Machine Learning designer has several pre-built components that can be used to prepare data for training. These components enable you to clean data, normalize features, join tables, and more.
- Train model: Split the data into two groups, a training and a validation set. Train a machine learning model using the training data set and applying a clustering algorithm to the data, using only the features that you have selected for clustering. Test the machine learning model for performance using the validation data set. You will use designer’s Assign Data to Clusters to generate cluster predictions from a trained clustering model. Once you connect all the components, you will want to run an experiment, which will use the data asset on the canvas to train a model.
- The K-Means Clustering algorithm groups items into the number of clusters, or centroids, you specify - a value referred to as
K. The K-Means algorithm works by:- Initializing
Kcoordinates as randomly selected points called centroids inn-dimensional space (wherenis the number of dimensions in the feature vectors). - Plotting the feature vectors as points in the same space, and assigning each point to its closest centroid.
- Moving the centroids to the middle of the points allocated to it (based on the mean distance).
- Reassigning the points to their closest centroid after the move.
- Repeating steps 3 and 4 until the cluster allocations stabilize or the specified number of iterations has completed.

- Initializing
- The K-Means Clustering algorithm groups items into the number of clusters, or centroids, you specify - a value referred to as
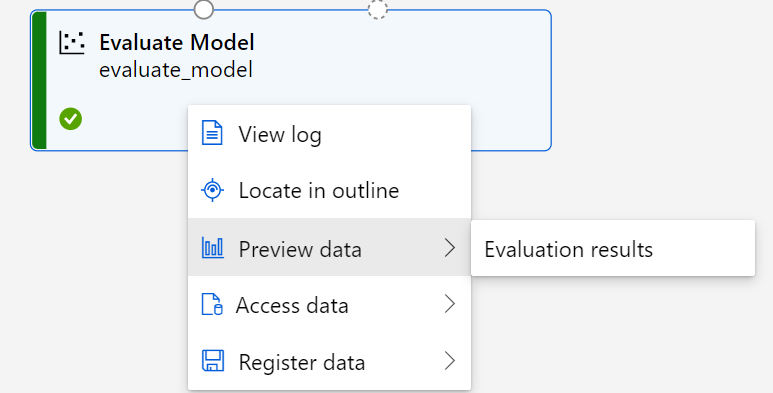
- Evaluate performance: There are many performance metrics and methodologies for evaluating how well a model makes predictions. You can review evaluation metrics on the completed job page by right-clicking on the Evaluate model component. When the experiment run has finished, select Job details. Right click on the Evaluate Model module and select Preview data, then select Evaluation results. These metrics include a row of metrics for each cluster, and a summary row for a combined evaluation. The metrics in each row are:
- Average Distance to Other Center: This indicates how close, on average, each point in the cluster is to the centroids of all other clusters.
- Average Distance to Cluster Center: This indicates how close, on average, each point in the cluster is to the centroid of the cluster.
- Number of Points: The number of points assigned to the cluster.
- Maximal Distance to Cluster Center: The maximum of the distances between each point and the centroid of that point’s cluster. If this number is high, the cluster may be widely dispersed. This statistic in combination with the Average Distance to Cluster Center helps you determine the cluster’s spread.
- Deploy a predictive service: After you train a machine learning model, you need to convert the training pipeline into a real-time inference pipeline. The inference pipeline performs the same data transformations as the first pipeline for new data. Then it uses the trained model to infer, or predict, label values based on its features. This model will form the basis for a predictive service that you can publish for applications to use. After creating the inference pipeline, you can deploy it as an endpoint. In the endpoints page, you can view deployment details, test your pipeline service with sample data, and find credentials to connect your pipeline service to a client application. The Deployment state on the Details tab will indicate Healthy when deployment is successful. On the Test tab, you can test your deployed service with sample data in a JSON format to test the service before connecting it to an application. You can find credentials for your service on the Consume tab. These credentials are used to connect your trained machine learning model as a service to a client application.
Summary
In this module, you learned how to:
- Identify common clustering machine learning scenarios.
- Use Azure Machine Learning designer to train a clustering model.
- Use a clustering model for inferencing.
- Deploy a clustering model as a service.
Source: Microsoft Learn